
Polarography - Determination of Unknown Concentration of Vitamin C
Introduction:
Jaroslav Heyrovsky received Nobel Prize in chemistry in 1959 for his discovery and development of the polarographic methods of analysis. He is known as the father of electroanalytical method. Polarographic method directly contributed to the development of innovative ideas in electrochemical techniques, instrumentation and applications.
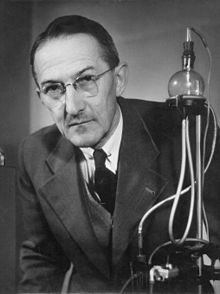
Jaroslav Heyrovský
Theory:
Voltammetry comprises a group of electroanalytical methods widely employed in analytical chemistry and other industrial processes. In voltammetry, the information about the analyte is obtained from the measurement of current as a function of applied potential, under the conditions of complete concentration polarization. Voltammetry is widely used by inorganic, physical and biological chemists for non-analytical purposes, such as the studies of the oxidation and reduction process, adsorption process in various media, and electron transfer processes at chemically modified electron surfaces.
Polarography, a branch of voltammetry, is the study of the electrolysis of solutions of electrooxidizable and/or electroreducible substances between a dropping mercury electrode (DME) and a reference electrode (RE), which is typically a saturated calomel electrode (SCE). This technique falls into the general category of linear-sweep voltammetry, where the electrode potential is usually altered linearly from an initial potential to a final potential.
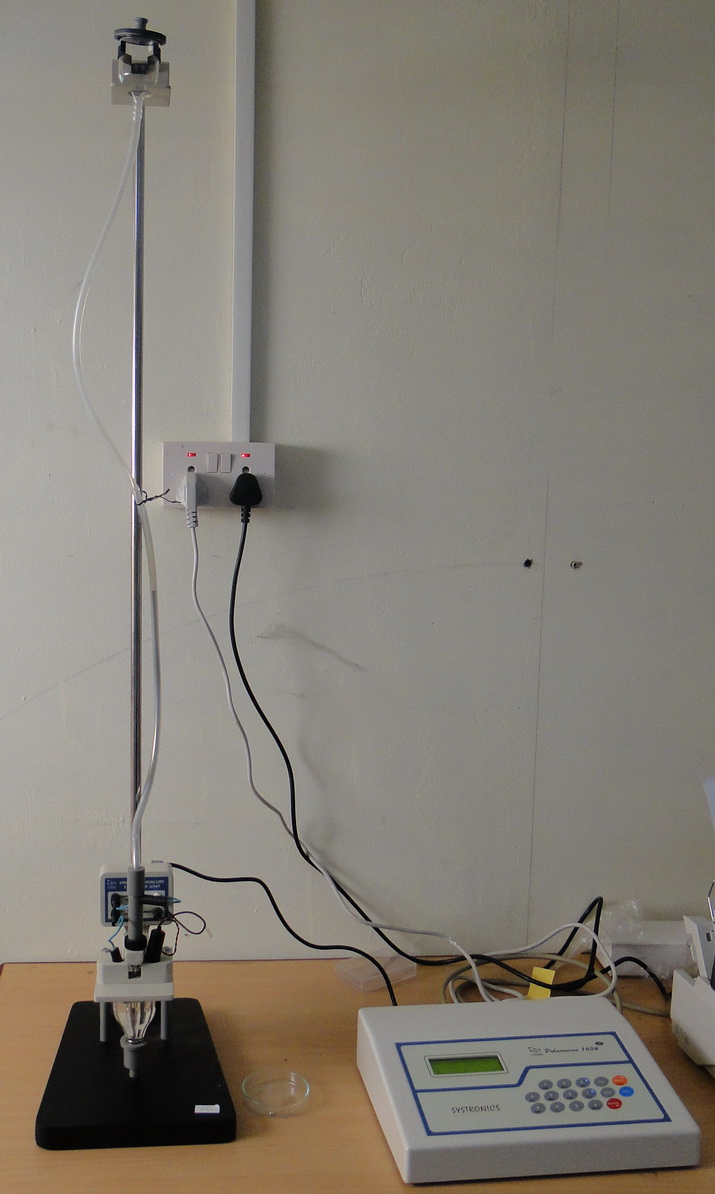
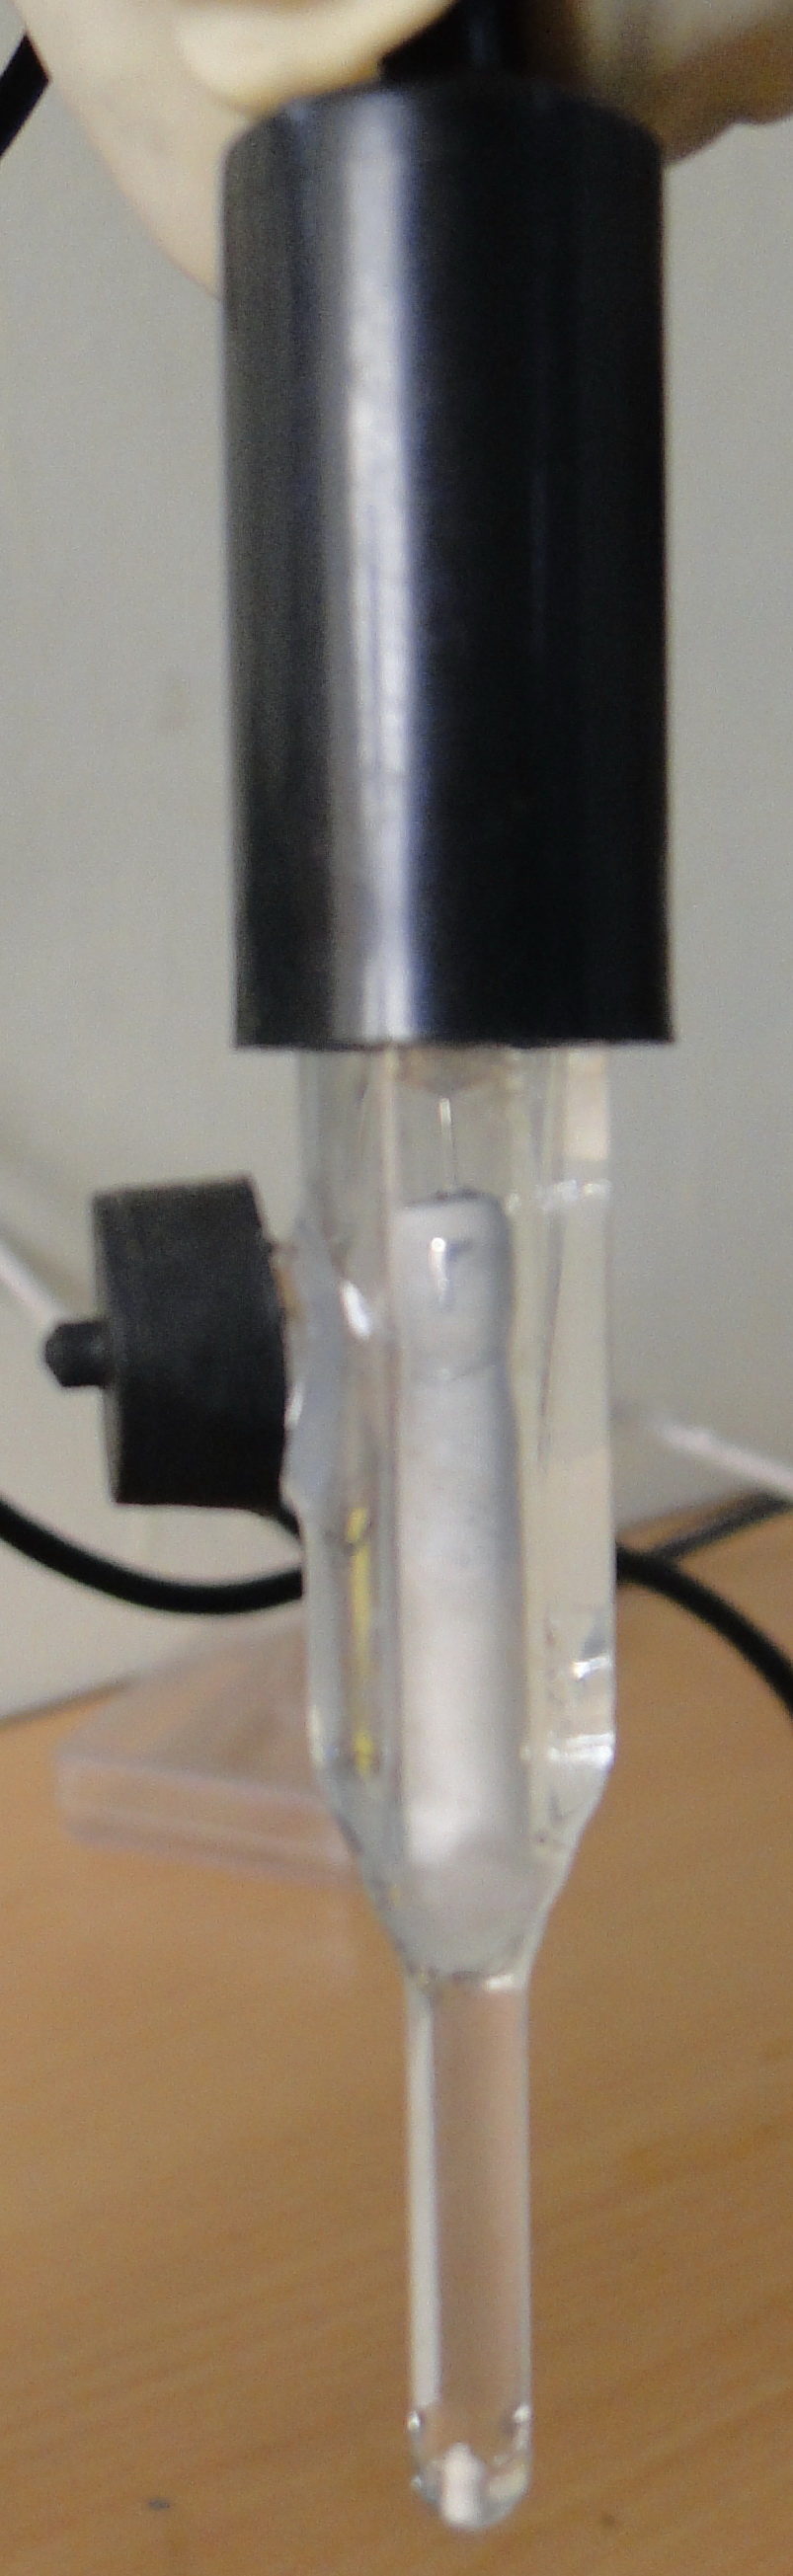
In polarography, the working electrode takes the form of a dropping mercury electrode (DME). It consists of about 10 cm of fine capillary tubing through which mercury is forced by a mercury head of about 50 cm. The diameter of the capillary tube is adjusted so that a new mercury drop forms and breaks at specific intervals, usually every 2 to 6 seconds. A mechanical knocker can control the drop time by dislodging the drop at a fixed time after formation.
The potential between the reference electrode and the DME is varied, and the resulting change in current flow is measured. Since the linear sweep method is governed by a combination of diffusion and convective mass transport, the current versus potential response (i-E curve) is known as a Polarogram, which is typically sigmoid (S-shaped) in form.
The position of a wave in a polarogram along the potential axis provides information on the identity of the substance, while the magnitude of the limiting current indicates the concentration of that substance.
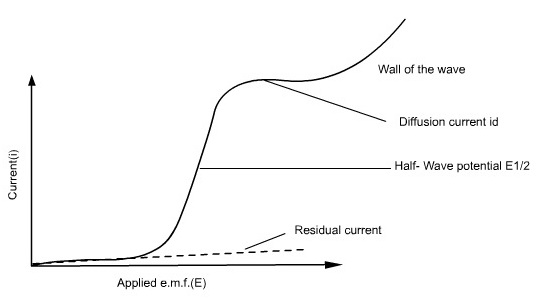
Figure 1: Polarogram
Since there is an increased flow of current at the starting region of the polarographic wave there is a marked decrease in the concentration of electro-active substance at the surface of the electrode. With the increase in voltage and current the concentration of the reactive species reaches to a minimal value near to the electrode surface. The current is then limited which depends on the diffusion rate of the reacting species from the solution to the electrode surface. The rapid increase of current at the final stage is due to the supporting electrolyte in the reaction. Since the concentration of the electrolyte is too large within the applied potential range, it will prevent the reactive species to reach the electrode by the electrical migration process, and hence the limiting current is assured as diffusion controlled.
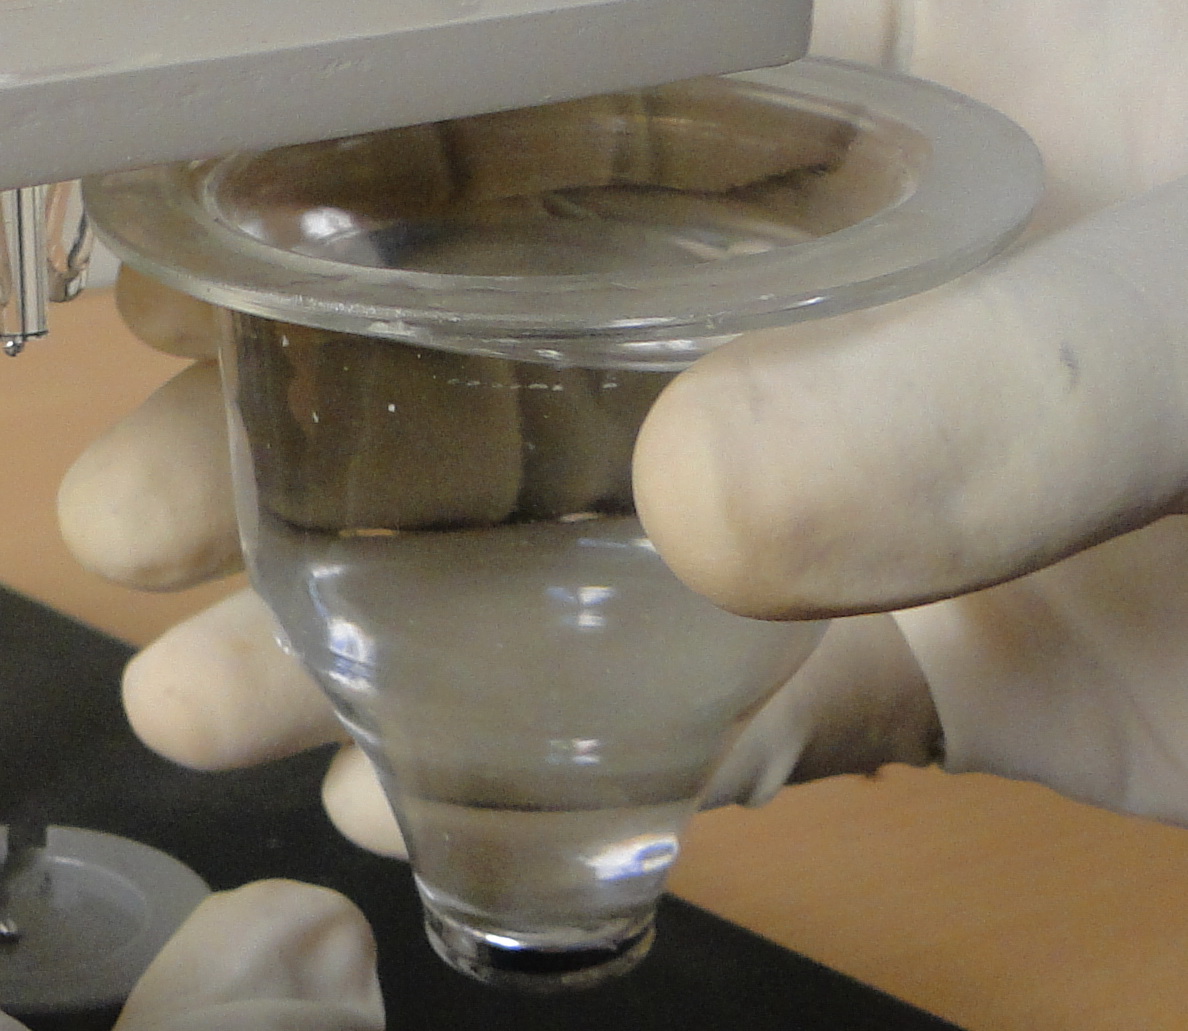
Polarographic cell
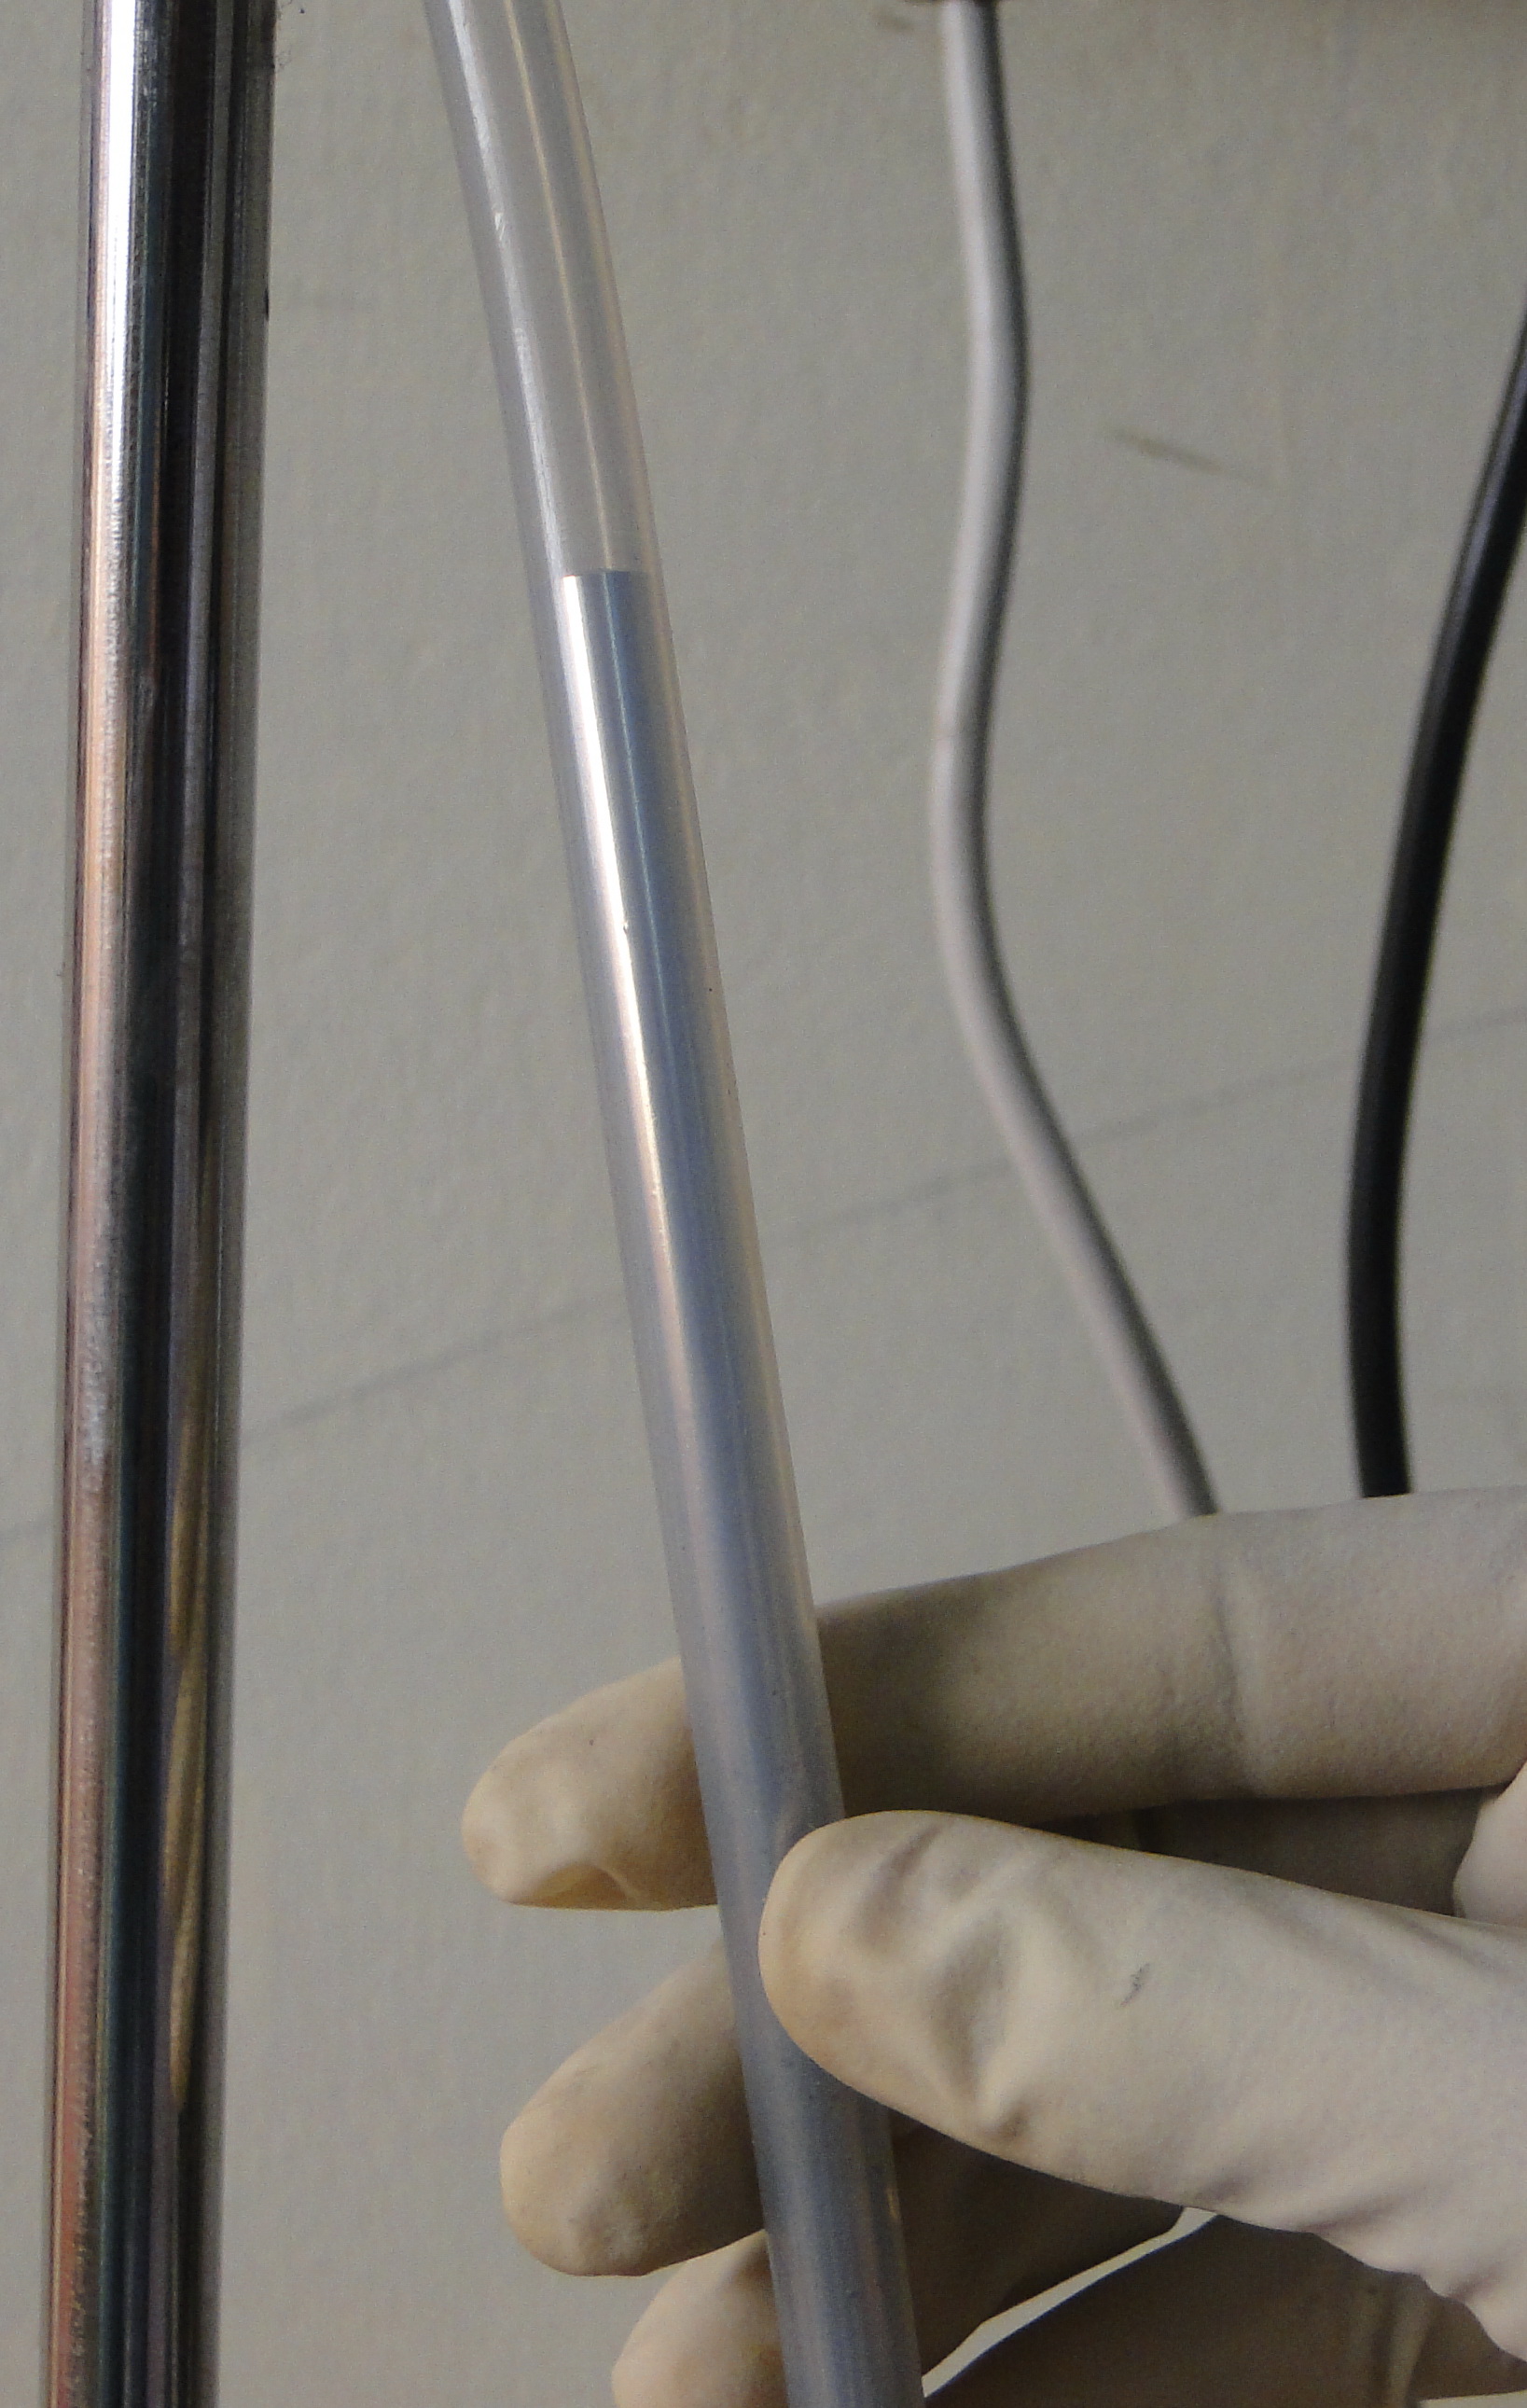
Tygon tube with mercury
Reference electrode (Saturated calomel electrode)
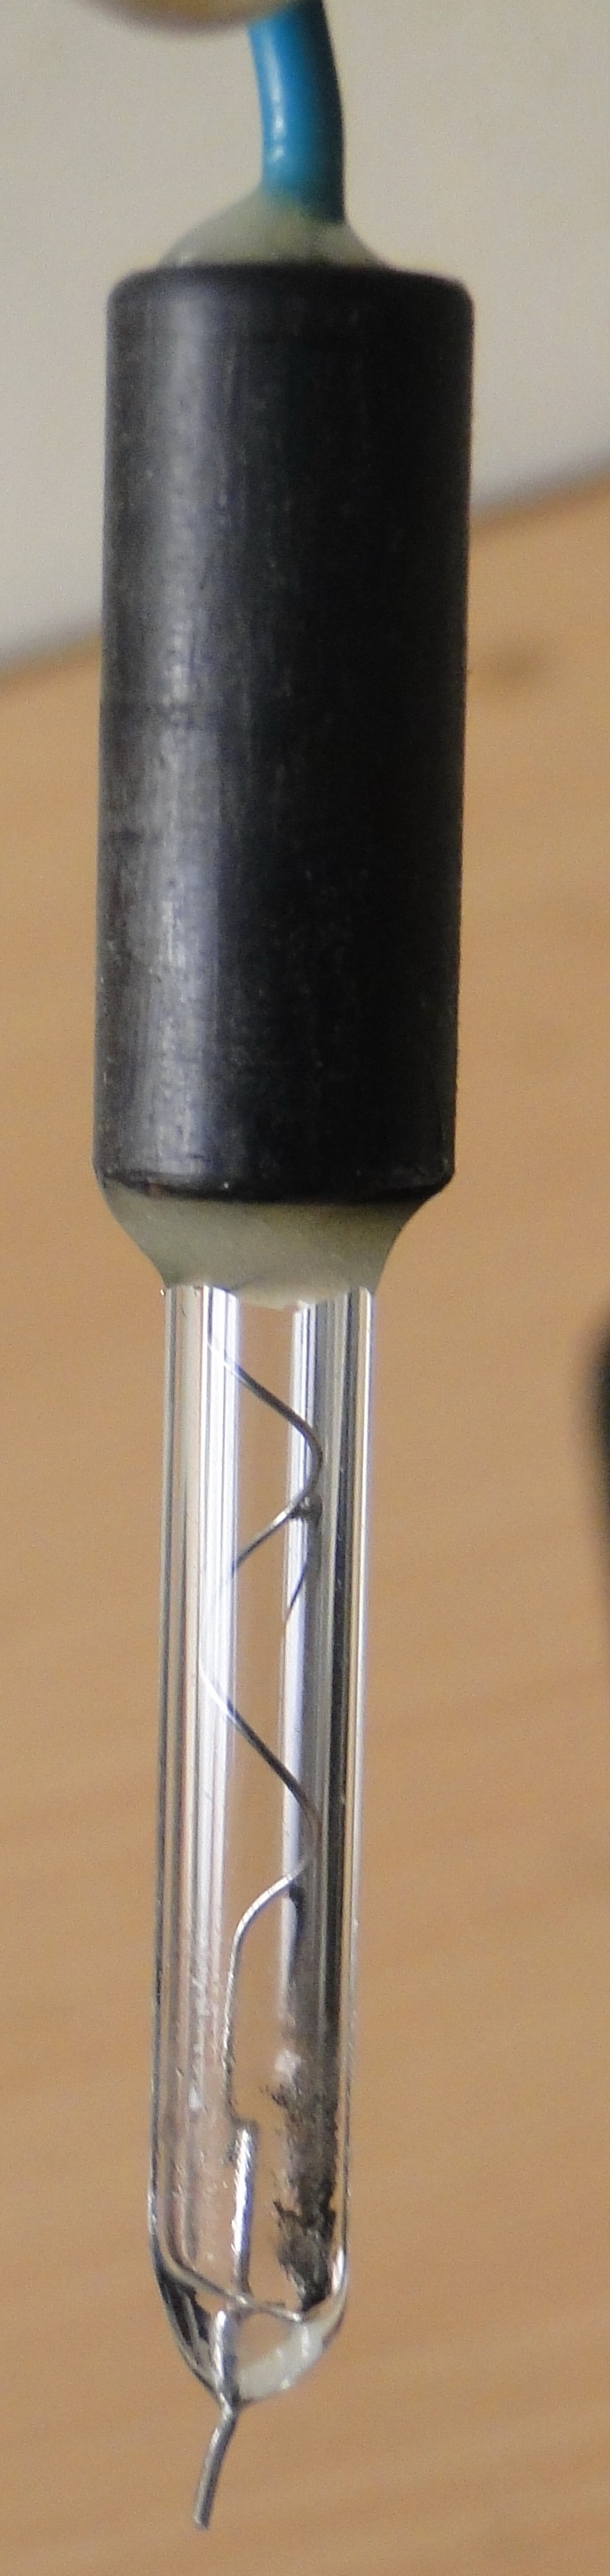
Auxillary electrode (Platinum electrode)
Residual current is the slowly increasing current at the foot of the wave which is non-faradaic in nature. The distance between the limiting diffusion plateau and the residual current is known as diffusion current (id). The potential at the midpoint of the wave is represented as half-wave potential (E1/2), in this region the current is exactly half its limiting value.
The limiting current is found to be the sum of the diffusion and residual currents. The wave height can be calculated by subtracting the residual current from the limiting current.
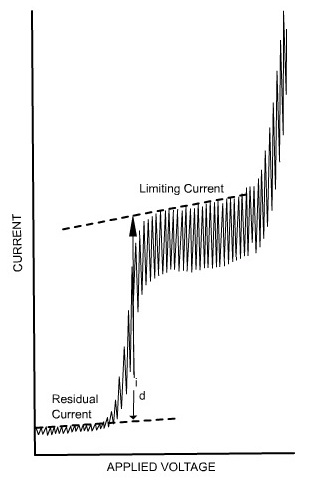
Fig 2.
The limiting current (the plateau on the sigmoid), called the diffusion current since diffusion is the most important contribution to the flux of electroactive material at that point of the Hg drop life, is linked to analyte concentration by the Ilković equation:
Where:
- id = diffusion current (μA)
- n = number of electrons involved in the reaction
- D = diffusion coefficient of the analyte (cm²/s)
- m = mass flow rate of mercury (mg/s)
- t = drop time (s)
- c = concentration of the analyte (mol/L)
Where,
E= applied voltage.
i= current.
Applications:
- Polarography is widely employed for the analysis of trace metals in alloys including ultra-pure metals, minerals/metallurgy, environmental analysis, foodstuffs, beverages, and body fluids, toxicology, and clinical analysis.
- In biological systems, it is used to determine vitamins, alkaloids, hormones, terpenoid substances, and more.
- In the medical field, polarography is used to analyze natural coloring substances in drugs and pharmaceutical preparations, determine pesticide or herbicide residues in foodstuffs, and help in structure determination of many organic compounds.
- Since a fresh, smooth, reproducible drop is produced at regular intervals, contamination or surface poisoning is limited.
Polarographic Analysis of Organic Compounds:
Polarography technique is employed in organic chemistry for qualitative and quantitative analysis and structure determinations of organic compounds. Since the organic compounds are insoluble in pure aqueous medium, the solvent in which the organic compound and its electrode product is soluble is added to the supporting electrolyte.
Examples of solvents include various alcohols or ketones, dimethyl formamide, acetonitrile, ethylene diamine and so on. The widely employed supporting electrolytes which are easily mixed with organic solvents are various quaternary ammonium salts such as tetrabutylammonium iodide.
List of Organic Functional Groups That Are Reducible at DME (Table 1):
| Functional Group | Structure (Simplified) | Example |
|---|---|---|
| Ketone | R–C(=O)–R' | Acetone |
| Aldehyde | R–CHO | Formaldehyde |
| Alkene | R–CH=CH–R' | Ethylene |
| Aryl alkyne | Ar–C≡C–R | Phenylacetylene |
| Azomethine | R₁R₂C=NR₃ | Benzylideneaniline |
| Nitrile | R–C≡N | Acetonitrile |
| Azo | R–N=N–R' | Azobenzene |
| Azoxy | R–N(O)=N–R' | Azoxybenzene |
| Peroxy | R–O–O–R' | Di-tert-butyl peroxide |
| Disulfide | R–S–S–R' | Cystine |
| Nitro | R–NO₂ | Nitrobenzene |
| Nitroso | R–NO | Nitrosobenzene |
| Hydroxylamine | NH₂OH | Hydroxylamine |
| Nitrite | R–ONO | Ethyl nitrite |
| Nitrate | R–ONO₂ | Methyl nitrate |
Organic Functional Groups Reducible at DME
Dibromides, aryl halides, alpha-halogenated ketones or aryl methanes, polynuclear aromatic ring systems, and heterocyclic double bonds are capable of being reduced at the Dropping Mercury Electrode (DME).
Mercaptans (–SH) oxidize at DME and give anodic currents.
Organic Functional Group Analysis of Non-polarographic Active Groups
Non-polarographic active groups can be converted into polarographically active groups and their polarographic behavior can then be studied (see Table 2).
| Functional Group | Reagent | Active Polarographic Group |
|---|---|---|
| Carbonyl | Girard T and D, Semicarbazide, Hydroxylamine | Azomethine, Carbazide, Hydroxylamine |
| Primary amine | Peperonal, CS₂, Cu₃(PO₄)₂ suspension | Azomethine, Dithiocarbonate (anodic), Copper(II) amine |
| Secondary amine | HNO₂ | Nitrosoamine |
| Alcohols | Chromic acid | Aldehyde |
| 1,2-Diols | Periodic acid | Aldehyde |
| Carboxyl | (Transform to thiouranium salts) | –SH (anodic) |
| Phenyl | Nitration | –NO₂ |
Determination of Ascorbic Acid (Vitamin C) in Citrus Juice
Methods: Standard Addition and Calibration Curve
Principle:
Ascorbic acid gives a well-defined polarographic oxidation wave. Use freshly prepared diluted juice for the determination of ascorbic acid.
Calibration Curve Method:
- Prepare a fresh stock solution of 50 cm³ of 0.2% ascorbic acid.
- Prepare 5 standard solutions of ascorbic acid in 25 cm³ volumetric flasks.
- To each flask, add 0.5 cm³ of 0.5M acetate buffer and varying volumes of 0.2% ascorbic acid: 0, 200, 400, 600, and 800 μdm³.
- Dilute to the mark with distilled water.
- Record polarograms for each solution over a potential range of -150 to +200 mV vs Ag/AgCl/1M KCl reference electrode.
- Plot 'id' vs 'c' of ascorbic acid to obtain the calibration curve.
Standard Addition Method:
- Squeeze juice (orange, grapefruit, or lemon) until about 10 cm³ is obtained.
- Filter through a porous funnel (pore size ~1 mm).
- Prepare four 25 cm³ volumetric flasks.
- Add to each: 0.5 cm³ of 0.5M acetate buffer, 2.0 cm³ of juice, and 0, 200, 400, or 600 μdm³ of 0.2% ascorbic acid.
- Dilute to mark with distilled water.
- Record polarograms under the same conditions as in the calibration step.
- Draw the standard additions plot and determine the concentration of ascorbic acid.
- Report the ascorbic acid concentration in the original juice sample in mol/L and ppm.